Wednesday 27 March 2013

Nifty 27 March 2013 : A Bullish Wolfe and a H&S.


Nifty charts show presence of a Head and shoulders pattern as well as a bullish Wolfe Wave. 

The H & S, which would target 5200, is shown in the chart below.


 The Wolfe Wave (WW), which targets above 6020, is shown on the charts below:


 Readers may choose their pick with strict SLs.  My bias is towards WW,  for which, I will have a mental SL of 5545 for the time being.

Sunday 17 March 2013

Nifty : Longer Term Perceptions

I am posting this chart for which I have many things to write.  I will do the writing part later.....Here is the chart..


Saturday 16 March 2013

Nifty 16 March 2013: Picture Gets Clearer

The see-saw in Nifty is likely to continue till March 2013 expiry and the moves are going to be oriented around 5850. The chart below endeavors to depict the path Nifty is likely to follow in the coming fortnight. There is an APF drawn in Red color (and believe me there can be many more drawn) and as I perceive the moves of Nifty  is going to be defined by this APF for some time with support from blue and green channels.


There are three WWs forming in Nifty and I expect them to compliment each other while they evolve their right shape.  I have already talked about two larger ones in my post Nifty 11 March 2013 : Two Potential Wolfe Waves and for the third to complete, Nifty must go below 5790.   

As per EW, as counted in isolation from 6112,  the fall to 5664 could be either a 3 wave or 5 wave ( and I am inclined to see it as a 3 wave form).  Inference would be that either the corrective got over at 5664 or only the A of the corrective is done.  I am taking it as A because EWO says so.  Hence B should do a minimum of 90% of A, which will take Nifty beyond 6067.  B.a again looks a clear 5 wave form to me and hence  I expect another rise, which is in line with the expectation for B.  However B.b is presently doing its own (c) (I expect (b) to be over already and (c) already started but the confirmation will come later).  Now if the fall from 5945 is B.b.(c) then it either show a 5 wave form either as an Impulse or an ED.  I am inclined for the former and expect it to complete between 5760-5720 by Monday close.  B.c and C will follow as 5 wave forms as shown on the chart.

EWO wise, at (c) it should go below (a) easily but when it rises for levels beyond 5972 it is bound to show negative divergence in hourly chart and indicate completion of B and indicate a shorting opportunity.

Trade Setup


For Bears : Good shorting opportunities would be available near or above 6070 only with SL of 6113 and target of 5650 or lower.

For Bulls : Go long between 5760 and 5705 with a SL of 5660 for a target of 6067.  Those inclined to hedge, may take 5700 options when the market opens without a gap down on Monday.


Tuesday 12 March 2013

Nifty: The Possible Route

The chart below shows the possible path, which could be followed by Nifty in next two to three days.  The APFs and WW supporting this view are also marked on the chart.  The reader should not forget the WWs that were posted in this blog yesterday in Nifty 11 March 2013 : Two Potential Wolfe Waves .


Monday 11 March 2013

Nifty 11 March 2013 : Two Potential Wolfe Waves

On Nifty there are two potential Wolfe Waves (WW).  Both shown in the chart below with the expected imaginary points that will be defined within two to three days...


Trade Setup

For Bulls -  Fresh longs can be initiated at thin red TL (roughly 5820) for a target of 5971+ SL 5776.

For Bears - Shorts can be initiated close to Red UTL with SL above Blue TL for a target of 5820, 5636, 5500, 5350.


Wednesday 6 March 2013

DLF: In a Corrective

DLF shows huge promise for bulls.  But, it presently seems to be in a 4th wave corrective, which has been depicted very simply in the chart below but can confuse the hell out of best of the ellioticians.


Update of DLF as on Holi day : 27 March 2013
The chart is posted below and I must admit that I used some vibrant colors on the chart to symbolise the festival of Holi:
 

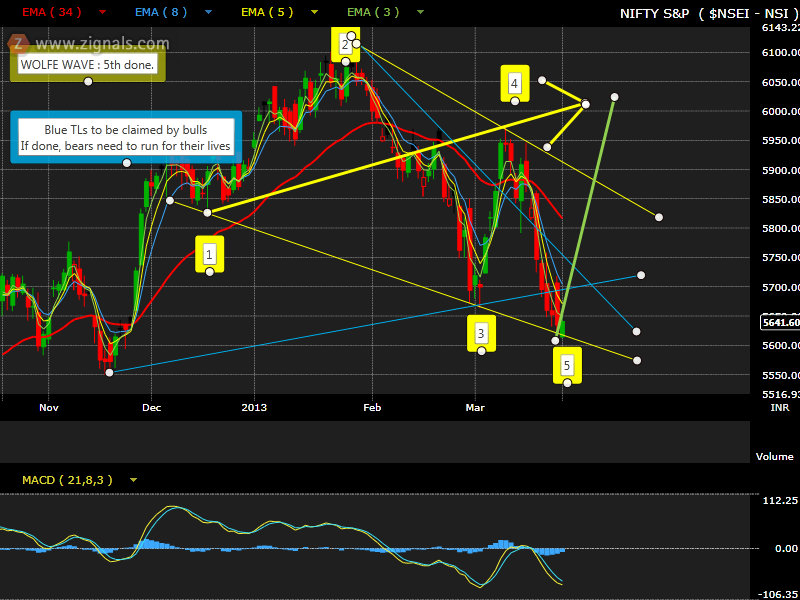
As I perceive, the green line from point 2 (in blue) alongwith LTL of blue APF should provide support to this fall, which I am assuming to be the 3rd fractal of an expanded corrective.  Broadly, we could also see a Wolfe wave forming, which is marked with blue numerals.  5th of this wolfe should go above yellow UTL close to T2 on the right corner of the chart.  The perception of an expanded corrective needs to be thrown out of the window, if and only if, the price falls below green LTL and sustains in red zone.  My perceptions of the future moves in DLF are based on the blue and + purple APFs alongwith  WW.

Pessimistically, I am expecting a rise through C (which may morph into 3rd) after the fall is done.  Target for C could be near 300, but if it turns out to be 3rd, it may well go towards 400 zone.  If and when it crosses above upper yellow line (without crossing the lower yellow line, which will make the WW invalid) , the upper yellow line will become the pivot and longs can be retained with SL inside the upper edge of the amber band.

The Trade Setup

For Bulls:
  Long as close to 217-220 band, with SL below  median line of brown APF initially (which could be shifted to just below the LTL of blue APF once the price stabilise in yellow band) for a target of upper edge of amber band and beyond yellow UTL.

For Bears: Shorts can be initiated close to median or UTL of purple APF with SL above UTL of purple APF for a target of LTL of purple APF.  Not very convinced of this one but if it happens, DLF may land up close to the green line drawn at right bottom corner of the chart.  Ideally a short at 252 with SL 255 (adhoc) and a short at 280 with SL at 282 for a target of 180 gives a good risk reward setup.