8627 could be end of a large degree wave, the corrective may test 7723. If 7723 is held bears may be mauled by carnivorous bulls.
One should also keep an eye on the WWs that are shown in the chart below. Both black Wolves are inactive at present and will be active below their respective baselines. The red WW is still in the making and its 4 should end in the red oval without violating the red LTL. But as I see it, the WWs may wait for a while but need to be monitored closely.
Trade as suited to each one of you.
Nifty Trade Setup - For Technical Analysis of Nifty and its shares. For Trade setup in Nifty and its shares.
Monday, 29 December 2014
Sunday, 21 December 2014
NIfty 22 December 2014 : Can go either way.
The setup for tomorrow:
Possibilities
My fav : Can swing between 7900 and 8250.
Possibility of a lateral 4th wave as CT : Can keep moving between 7960 and 8500.
Not to forget the aspirations of a new high, which I am not charting here.
Trade bearish, with SL of 8350 initially for a target of 7925/7800/7500
Trade bullish, with SL of 7960, at 8080 for a target of 8450/8550/8700+.......9200
I am expecting a bearish tone till mid Jan, then a rise till end feb to mid Mar and then a substantial drop.
God knows if a Harshad Mehta or Ketan Parekh will surface by then. SEBI has already barred 260 entities from markets due suspicions of money laundering.
All the best.
Friday, 19 December 2014
Sunday, 9 November 2014
DLF 10 November 2014 : What could cause a 61.15 fall.
DLF has been in news for a long time, courtesy Mr Robert Vadera, the famous or rather infamous son in law, and his associates. I have written about DLF in past. But the situation that is prevalent, prompted a review.
Most of the recent write ups on DLF are giving bullish sentiments. Some saying 140 and some 150+ as their Target. IMHP, DLF is almost at the end of its current rise. This correction has already entered the gap that was created on the day of recent fall and I find it difficult for DLF to stretch much beyond 138.
On Friday, I missed the news and shorted it at around 134 and kept wondering about the crisp rise that continued to sustain the entire day.
That brought me back to the charts and my perception is that it is ripe for another big dip of 61.15 or more from wherever it starts. The nearest low could be seen very close to the expiry day. Since 100.15 was the last low, a short around 137 for a target below 100 (and when that happens, EW will mandate 61.2 for the fall) with a SL of 140.25 may be attempted.
What would cause such fall is anybody's guess. But as I have mentioned earlier, that TA at times tends to create news that no one expects. Seems Vadera is in for a big run for his money. Let us keep our fingers crossed.
PS. I would love to have the views of the readers here on the central question. Which is....What could cause a fall of 61.2 points in DLF in next 13.days?
Sunday, 2 November 2014
Nifty 03 November 2014 : A long way to go
My last detailed post on Nifty was posted at Nifty 04 September 2014 : Last week did clear some clouds but what next?. Subsequent moves have shaped up more or less in that manner. On last trading day, Nifty breached an important level at 8264, which now mandates Nifty to go beyond 8540. While that condition is set, how much beyond could Nifty scale in this rise?
The limits are set by two counts:
Firstly: The counts of ED restrict the fifth to 1.618 times the third in the following manner, which limits the move to 8758.
Secondly: The counts of last move may shape as a 3 wave form, or may develop into an ED themselves. I am trying to fix the move as 3 wave while keeping the ED as alternate.
The 3 wave form of the rise, at its best, could shape up as
Needless to say that every fractal here is shown as a projection. The actual values as well as their respective forms may differ.
The current rise from 7723 seems to be shaping up as an impulse and may at its largest fractal show us following values:
My take is that the correctives may not dip below 8250 now till completion of A.
Since this rise may be shaping up as the final fractal for the move from either 5118 or 5933, the subsequent corrective should come down by 600-700 points at the minimum.
I would prefer to shift my sight to Jun 2015. A covering position of 8900 or 9000 CEs of Jun 2015 may be taken now. A counter position in same or next month expiry (the month in which position is being taken or next month) via 8500 PEs or 8400 PEs as well as 7900 PEs of Jun 2015 expiry may be taken when Nifty reaches above 8540. If Nifty dips to 7930, the counter positions of the closer month expiry should be closed and CEs of 8100/8200 should be initiated.
This may be repeated again when Nifty reaches 8700+ with June positions intact.
God bless.
The limits are set by two counts:
Firstly: The counts of ED restrict the fifth to 1.618 times the third in the following manner, which limits the move to 8758.
i | : | 7422 | - | 7841 | = | 419 | |||
ii | : | 7841 | - | 7540 | = | -301 | ( | -71.8377 | ) |
iii | : | 7540 | - | 8180 | = | 640 | ( | 152.7446 | ) |
iv | : | 8180 | - | 7723 | = | -457 | ( | -71.4063 | ) |
v | : | 7723 | - | 8758 | = | 1035 | ( | 161.7188 | ) |
Secondly: The counts of last move may shape as a 3 wave form, or may develop into an ED themselves. I am trying to fix the move as 3 wave while keeping the ED as alternate.
The 3 wave form of the rise, at its best, could shape up as
|
|||||||||||||||||||||||||||||||||||||||
Needless to say that every fractal here is shown as a projection. The actual values as well as their respective forms may differ.
The current rise from 7723 seems to be shaping up as an impulse and may at its largest fractal show us following values:
1 | : | 7723.95 | - | 7933.55 | = | 209.6 | |||
2 | : | 7933.55 | - | 7874 | = | -59.55 | ( | 28.41126 | ) |
3 | : | 7874 | - | 8450 | = | 576 | ( | 274.8092 | ) |
4 | : | 8450 | - | 8310 | = | -140 | ( | 24.30556 | ) |
5 | : | 8310 | - | 8540 | = | 230 | ( | 109.7328 | ) |
My take is that the correctives may not dip below 8250 now till completion of A.
Since this rise may be shaping up as the final fractal for the move from either 5118 or 5933, the subsequent corrective should come down by 600-700 points at the minimum.
I would prefer to shift my sight to Jun 2015. A covering position of 8900 or 9000 CEs of Jun 2015 may be taken now. A counter position in same or next month expiry (the month in which position is being taken or next month) via 8500 PEs or 8400 PEs as well as 7900 PEs of Jun 2015 expiry may be taken when Nifty reaches above 8540. If Nifty dips to 7930, the counter positions of the closer month expiry should be closed and CEs of 8100/8200 should be initiated.
This may be repeated again when Nifty reaches 8700+ with June positions intact.
God bless.
Thursday, 23 October 2014
HAPPY DEEPAWALI
BEST WISHES AND A VERY HAPPY AND PROSPEROUS DEEPAWALI TO ALL READERS.
MAY GODDESS LAKSHMI SHOWER HER BLESSINGS UPON ALL OF YOU.
GOD BLESS.
MAY GODDESS LAKSHMI SHOWER HER BLESSINGS UPON ALL OF YOU.
GOD BLESS.
Saturday, 18 October 2014
Getting Away
This Saturday, I am going on vacations, which should help me get away from the charts for couple of weeks. I will try and track the Nifty but it is unlikely that I would be able to do any worthwhile technical analysis during this time.
A much awaited break for me. Hope to get back after 21 November this year.
Best of Luck to the readers.
A much awaited break for me. Hope to get back after 21 November this year.
Best of Luck to the readers.
Thursday, 16 October 2014
Nifty Breached 7745 but Wolves Must be Kept Track of
In my last post I had talked about couple of Wolfe Waves developing in Nifty. Today's fall has completed the 5th wave of the incomplete wave.
While the lack of divergence may indicate further fall, the things may turn around if Nifty starts closing above the baseline. Things do look gloomy for now but a change may not take much efforts from bulls to kick start these wolves.
SUGGEST KEEP AN EYE ON THEM..
While the lack of divergence may indicate further fall, the things may turn around if Nifty starts closing above the baseline. Things do look gloomy for now but a change may not take much efforts from bulls to kick start these wolves.
SUGGEST KEEP AN EYE ON THEM..
Monday, 13 October 2014
Nifty on 13 October 2014 : Wolfe Waves - One on Target, Second yet to Launch
The Wolfe Waves aka WWs are depicted in blue and black in the chart below :
Indications are that Nifty may head for 8100+ very rapidly. Possible paths are depicted on the chart.
7740 remains the SL for longs. Shorts however must keep SL at 7975 or 8035 as per own risk appetite.
Indications are that Nifty may head for 8100+ very rapidly. Possible paths are depicted on the chart.
7740 remains the SL for longs. Shorts however must keep SL at 7975 or 8035 as per own risk appetite.
Thursday, 4 September 2014
Nifty 04 September 2014 : Last week did clear some clouds but what next?
Last month I wrote on possibilities that were emerging in Nifty at Nifty Trade Setup 21 August 2014 : The most crucial phase for both bulls and bears and Nifty on 27 August 2014: The highs may still be counting but its time to look lower and had mentioned certain levels to resolve certain possibilities. At this juncture, most of the possibilities that were mentioned has been resolved and possibly few more have emerged. Let us see what they were and whether they remain valid.
The possibilities that were held firm till last month are:
Expanded wave from 6357 made in January 2008....invalid now.
Expanded wave from 7841 made last month....invalid now.
ED from 7118 made on 30 May 2014......invalid now.
With the expanded possibilities invalidated, it will be safe to assume that Nifty is still in the initial segment of a long long journey. Since 2008 the lowest point touched was 2252 and assumption of an impulse having commenced from this point would not be totally misplaced. However, a confirmation would still be required at a future date as and when it comes. Let us see the impulsive compulsions of this move:
What is visible here is that (III) will become extended only above 11144 at 161.8 %. But it should also be kept in mind that (III) has potential to scale upto 21900 at 425% if it decides to do so. Since the move is presently in (III) let us see what is happening there.
Here III has already become extended, however, it must be remembered that it has potential to go upto 12334 at 425%. Now let us see what is happening within III.
Here again 3 has already become extended, however, it must be remembered that 3 has potential to go upto 11445 at 425%. Now let us see what is happening within III.
Here it is worth while to mention that there is another alternate which validates the move from 6357 (Jan 08) to 5116 (Aug 13) as a CT. Even if this be the case, the move from 5118 should resolve as an impulse as it progresses. At this juncture 5118 onwards is where the concentration should lie for most ellioticians as the previous move are yet to go a long way for any meaningful resolution. Now let us see the other possibilities from 5118.
Alternate 1
Here 3 is extended with respect to 5 till 8145 and a tick at 8146 will make this alternate invalid.
Alternate 2
Here also 3 is extended with respect to 5 till 8263 and a tick at 8264 will make this alternate invalid. 4 is labelled at 7540 is this case.
In these two alternates the 3 has been considered completed at 7809 (I am not convinced on this). So let us see if the 5th in each case shows up as an ED or an impulse. This is the best I could get to.
Alternate 1
This possibility has gone beyond the limits for any possibility of an extension of iii with respect to vth. Hence vth itself will need to get extended for which it must cross 8540.
Alternate 2
In this, iii may or may not be complete. iv has scope to go down till 7969. v must cross 173 points and must not cross 8263. Because if it does, higher degree count will become invalid.
Most Acceptable Count
iii here may still be continuing and would become extended above 8154. It also has scope to go till 10618 at 425%.
Here (iii) must go beyond 9435 to become extended. Will it go? Time shall tell. There is an alternate for this which can finish the move below 8290 and may have already finished, but I am not really convinced on this one.
Trade Setup
For Bulls: Go long near 8030, SL 7967 Target 8555.
For Bears: Go short near 8140 SL 8155 Target 8030/7969/ 7862/....7700/7300
PS. I will try and include charts in this post at a later stage. But members may consider drawing their own charts for these counts.
The possibilities that were held firm till last month are:
Expanded wave from 6357 made in January 2008....invalid now.
Expanded wave from 7841 made last month....invalid now.
ED from 7118 made on 30 May 2014......invalid now.
With the expanded possibilities invalidated, it will be safe to assume that Nifty is still in the initial segment of a long long journey. Since 2008 the lowest point touched was 2252 and assumption of an impulse having commenced from this point would not be totally misplaced. However, a confirmation would still be required at a future date as and when it comes. Let us see the impulsive compulsions of this move:
(I) | : | 2252 | - | 6339 | = | 4087 | 100 | ||
(II) | : | 6339 | - | 4531 | = | -1808 | ( | -44.2378 | ) |
(III) | : | 4531 | - | 11144 | = | 6613 | ( | 161.8057 | )* |
What is visible here is that (III) will become extended only above 11144 at 161.8 %. But it should also be kept in mind that (III) has potential to scale upto 21900 at 425% if it decides to do so. Since the move is presently in (III) let us see what is happening there.
I | : | 4531 | - | 6229 | = | 1698 | |||
II | : | 6229 | - | 5118 | = | -1111 | ( | -65.4299 | ) |
III | : | 5118 | - | 8142 | = | 3024 | ( | 178.0919 | )* |
Here III has already become extended, however, it must be remembered that it has potential to go upto 12334 at 425%. Now let us see what is happening within III.
1 | : | 5118 | - | 6415 | = | 1297 | |||
2 | : | 6415 | - | 5933.3 | = | -481.7 | ( | -37.1396 | ) |
3 | : | 5933.3 | - | 8142 | = | 2208.7 | ( | 170.293 | ) * |
Here again 3 has already become extended, however, it must be remembered that 3 has potential to go upto 11445 at 425%. Now let us see what is happening within III.
Here it is worth while to mention that there is another alternate which validates the move from 6357 (Jan 08) to 5116 (Aug 13) as a CT. Even if this be the case, the move from 5118 should resolve as an impulse as it progresses. At this juncture 5118 onwards is where the concentration should lie for most ellioticians as the previous move are yet to go a long way for any meaningful resolution. Now let us see the other possibilities from 5118.
Alternate 1
1 | : | 5933.3 | - | 6869.85 | = | 936.55 | ||||
2 | : | 6869.85 | - | 6638.55 | = | -231.3 | ( | -24.697 | ) | |
3 | : | 6638.55 | - | 7809 | = | 1170.5 | ( | 124.9746 | ) | |
4 | : | 7809 | - | 7422 | = | -387 | ( | -33.0642 | ) | |
5 | : | 7422 | - | 8145 | = | 723 | ( |
|
) Max |
Here 3 is extended with respect to 5 till 8145 and a tick at 8146 will make this alternate invalid.
Alternate 2
1 | : | 5933.3 | - | 6869.85 | = | 936.55 | |||
2 | : | 6869.85 | - | 6638.55 | = | -231.3 | ( | -24.697 | ) |
3 | : | 6638.55 | - | 7809 | = | 1170.5 | ( | 124.9746 | ) |
4 | : | 7809 | - | 7540 | = | -269 | ( | -22.9826 | ) |
5 | : | 7540 | - | 8263 | = | 723 | ( | 161.888 | ) Max |
Here also 3 is extended with respect to 5 till 8263 and a tick at 8264 will make this alternate invalid. 4 is labelled at 7540 is this case.
In these two alternates the 3 has been considered completed at 7809 (I am not convinced on this). So let us see if the 5th in each case shows up as an ED or an impulse. This is the best I could get to.
Alternate 1
i | : | 7422 | - | 7841 | = | 419 | |||
ii | : | 7841 | - | 7540 | = | -301 | ( | -71.8377 | ) |
iii | : | 7540 | - | 7968 | = | 428 | ( | 102.148 | ) |
iv | : | 7968 | - | 7862 | = | -106 | ( | -24.7664 | ) |
v | : | 7862 | - | 8141 | = | 279 | ( | 65.18692 | ) |
This possibility has gone beyond the limits for any possibility of an extension of iii with respect to vth. Hence vth itself will need to get extended for which it must cross 8540.
Alternate 2
|
In this, iii may or may not be complete. iv has scope to go down till 7969. v must cross 173 points and must not cross 8263. Because if it does, higher degree count will become invalid.
Most Acceptable Count
i | : | 5933.3 | - | 6869.85 | = | 936.55 | |||
ii | : | 6869.85 | - | 6638.55 | = | -231.3 | ( | -24.697 | ) |
iii | : | 6638.55 | - | 8141 | = | 1502.5 | ( | 160.4239 | )* |
iii here may still be continuing and would become extended above 8154. It also has scope to go till 10618 at 425%.
(i) | : | 6638 | - | 7809 | = | 1171 | LD | ||
(ii) | : | 7809 | - | 7540 | = | -269 | ( | -22.9718 | ) |
(iii) | : | 7540 | - | 8142 | = | 602 | ( | 51.40905 | ) |
Here (iii) must go beyond 9435 to become extended. Will it go? Time shall tell. There is an alternate for this which can finish the move below 8290 and may have already finished, but I am not really convinced on this one.
Trade Setup
For Bulls: Go long near 8030, SL 7967 Target 8555.
For Bears: Go short near 8140 SL 8155 Target 8030/7969/ 7862/....7700/7300
PS. I will try and include charts in this post at a later stage. But members may consider drawing their own charts for these counts.
Tuesday, 26 August 2014
Nifty on 27 August 2014: The highs may still be counting but its time to look lower.
I wrote about my appreciation of Nifty in my last post Nifty Trade Setup 21 August 2014 : The most crucial phase for both bulls and bears. It is clear now that none of the possibilities mentioned in the last post hold any merit and a re-orientation of EW needs to be done.
The perceptions upto weekly still hold good, but, the thoughts on daily chart needs to be re-organised. With breach of 7959, the possibility of an ED from 7118 becomes invalid and leaves few other possibilities in its wake for ellioticians to ponder upon.
If we consider the move from 4531 as shown in my previous post, the third wave is already extended. However, within the 3rd wave starting from 5118, the moves have become complicated for an impulse. My endeavour will be to resolve this segment to acceptable possibilities.
As impulse, with the possibility of 3rd extension, the move from 5118 seems to be shaping up as below:
1 | : | 5118 | - | 6415 | = | 1297 | |||
2 | : | 6415 | - | 5933.3 | = | -481.7 | ( | -37.14 | ) |
3 | : | 5933.3 | - | 7968 | = | 2034.7 | ( | 156.88 | ) of 1 and |
At this juncture, not much clarity is shown by the moves from 5933, especially
when all the ticks are accounted for. However, if closing values are
taken and help of other indicators are used to identify the fractals, a
possibility emerges. For which, EW counts for the fractals of move from 5933 may be developing as below:
i | : | 5933.3 | - | 6869.85 | = | 936.55 | |||
ii | : | 6869.85 | - | 6638.55 | = | -231.3 | ( | -24.697 | ) |
iii | : | 6638.55 | - | 7809 | = | 1170.5 | ( | 124.9746 | ) |
iv | : | 7809 | - | 7422 | = | -387 | ( | -33.0642 | ) |
v | : | 7422 | - | 8001 | = | 579 | ( | 61.82265 | ) of i ** |
Where v th has to push between 8001 and 8145 to keep iii rd extended and i st unextended. It should also go past 8031 to get 3 rd wave of higher degree extended. The wave itself may be developing as an ED as below:
1 | : | 7422 | - | 7841 | = | 419 | |||
2 | : | 7841 | - | 7540 | = | -301 | ( | -71.8377 | ) |
3 | : | 7540 | - | 7968 | = | 428 | ( | 102.148 | ) |
4 | : | 7968 | - | 7658 | = | -310 | ( | -72.38 | )** |
5 | : | 7658 | - | 8095 | = | 437 | ( | 102.1028 | )** |
The point to remember here is that the 5th must go beyond 8001 but cannot go beyond 8145 because if it does, the higher degree presumptions will become invalid. It also needs to go beyond 8031 to make the 3rd wave at a higher degree extended. The whole setup are depicted on the chart below:
Now let us see how the fall from 7968 has developed so far.
Simply put, the fractals of the fall may have developed to satisfy this
A : 7968.25 - 7874.05 = -94.2
B : 7874.05 - 7915.45 = 41.4 ( -43.94904459 )
C : 7915.45 - 7862.7 = -52.75 ( 55.99787686 )
T1: 7857.2344 , T2: 7821.25 , T3: 7763.0344
It may still continue in this manner, as long as 7915.45 is not taken. However, if we look at it a little differently, we may see fractals of B developing in the following manner. (If 7915.45 is taken out, the possibility will continue to exist as long as 7968.25 is not taken out. I am banking on T3 of B, which is the most probable target of an expanded.)
a : 7874.05 - 7915.45 = 41.4
b : 7915.45 - 7862.7 = -52.75 ( -127.4154589 )
c : 7862.7 - 7929 = 66.3 ( 160.1449275 )**
T1: 7888.2852, T2: 7904.1, T3: 7929.6852, T4: 7971.0852
With 7929 in focus for end of B, the possibility for C is as below.
A : 7968.25 - 7874.05 = -94.2
B : 7874.05 - 7929 = 54.95 ( -58.33333333 )**
C : 7929 - 7862.7 = -66.3 ( 70.38216561 )**
T1: 7870.7844 , T2: 7834.8 , T3: 7776.5844
A breach below T3 will prompt me to change to counting it as an impulse and target 7730 for an A wave of the corrective. Till then, 7780 remains my target.
The chart depicting the setup is as below:
Wednesday, 20 August 2014
Nifty Trade Setup 21 August 2014 : The most crucial phase for both bulls and bears
I had posted my views on Nifty a long time back in Nifty 14 January 2014 : Three Wolves, All Pointing Downwards and Alive. While one of these wolves met the target, other two fell short. Subsequent rise continued to push Nifty towards unscaled levels and here it is...at levels that may be extremes of some of the possibilities. Let us see how Nifty is shaping up.
Monthly
In monthly, the price action has reached the UTL of a very LT EW channel. Getting resisted here is highly probable. Another aspect that needs to be kept in mind is that the move from 6357 (marked as A) continues to hold the possibility to turn into an expanded till 7925. If we look at the indicators, the negative divergence in both RSI and BEBO are held wrt A, but, there is no negative divergence within the move from 2252 (marked B). I infer that the current rise still holds momentum for newer highs in future.
Weekly
The EW labels and possible channels, as perceived by me, are marked on the chart below. No negative divergence visible in both RSI and BEBO. The EW ratios work out as below and clearly shows that the current move from 5118 as 3 has become extended:
While we can delve deeper in the monthly and weekly charts later as the moves evolve, let us see certain key elements of the daily chart.
Firstly, in the above counts, ii and iv both are shallow. I have seen it happening on occasions and hence tend to accept it for the time being. Within iii, the (iv) is just 17.66 % and this one is also accepted with a pinch of salt.
Now, if this is how nifty is shaping up, then,
v should finish between 7920 (already done) and 8126. If 8126 is violated, nifty will have to scale 9217 to make v extended wrt i.
To resolve the possibility of an expanded move from 7808, nifty need to cross 7956. If it does not, the possibility will remain alive.
If v is developing as an ED as shown, maximum it can go is upto 7959. Above this, (iii) of the ED will become smallest, which is not permissible and a reorientation will be necessary.
Given these parameters, 7920-7925 and 7956-7959 bands are crucial. Ideally, if Nifty reverses from 7956-7959 band, all expanded possibilities would have resolved and what will follow would be 4 that may bring a decent reduction to the levels of Nifty. Minimum expectation will be 7260 at 23.6%.
Monthly
In monthly, the price action has reached the UTL of a very LT EW channel. Getting resisted here is highly probable. Another aspect that needs to be kept in mind is that the move from 6357 (marked as A) continues to hold the possibility to turn into an expanded till 7925. If we look at the indicators, the negative divergence in both RSI and BEBO are held wrt A, but, there is no negative divergence within the move from 2252 (marked B). I infer that the current rise still holds momentum for newer highs in future.
Weekly
The EW labels and possible channels, as perceived by me, are marked on the chart below. No negative divergence visible in both RSI and BEBO. The EW ratios work out as below and clearly shows that the current move from 5118 as 3 has become extended:
1 | : | 4531 | - | 6229 | = | 1698 | |||
2 | : | 6229 | - | 5118 | = | -1111 | ( | -65.4299 | ) |
3 | : | 5118 | - | 7922 | = | 2804 | ( | 165.1355 | ) |
Daily
The EW labels and possible channels, as perceived by me, are marked on the chart below. Negative divergence is visible in both RSI and BEBO. But the pattern of the indicators keeps me concerned on the positioning of black iii. The EW ratios work out as below and clearly shows that the current move from 5118 as 3 has become extended:
i | : | 5118 | - | 6415 | = | 1297 | |||
ii | : | 6415 | - | 5933.3 | = | -481.7 | ( | -37.1396 | ) |
iii | : | 5933.3 | - | 7563.5 | = | 1630.2 | ( | 202.9 | ) of v |
iv | : | 7563.5 | - | 7118.55 | = | -445 | ( | -27.2942 | ) |
v | : | 7118.55 | - | 7922 | = | 803.45 | ( | 61.9468 | ) of i |
While we can delve deeper in the monthly and weekly charts later as the moves evolve, let us see certain key elements of the daily chart.
Firstly, in the above counts, ii and iv both are shallow. I have seen it happening on occasions and hence tend to accept it for the time being. Within iii, the (iv) is just 17.66 % and this one is also accepted with a pinch of salt.
Now, if this is how nifty is shaping up, then,
v should finish between 7920 (already done) and 8126. If 8126 is violated, nifty will have to scale 9217 to make v extended wrt i.
To resolve the possibility of an expanded move from 7808, nifty need to cross 7956. If it does not, the possibility will remain alive.
If v is developing as an ED as shown, maximum it can go is upto 7959. Above this, (iii) of the ED will become smallest, which is not permissible and a reorientation will be necessary.
Given these parameters, 7920-7925 and 7956-7959 bands are crucial. Ideally, if Nifty reverses from 7956-7959 band, all expanded possibilities would have resolved and what will follow would be 4 that may bring a decent reduction to the levels of Nifty. Minimum expectation will be 7260 at 23.6%.
Monday, 17 February 2014
State Bank of India on 16 February 2014 : Remains Bearish.
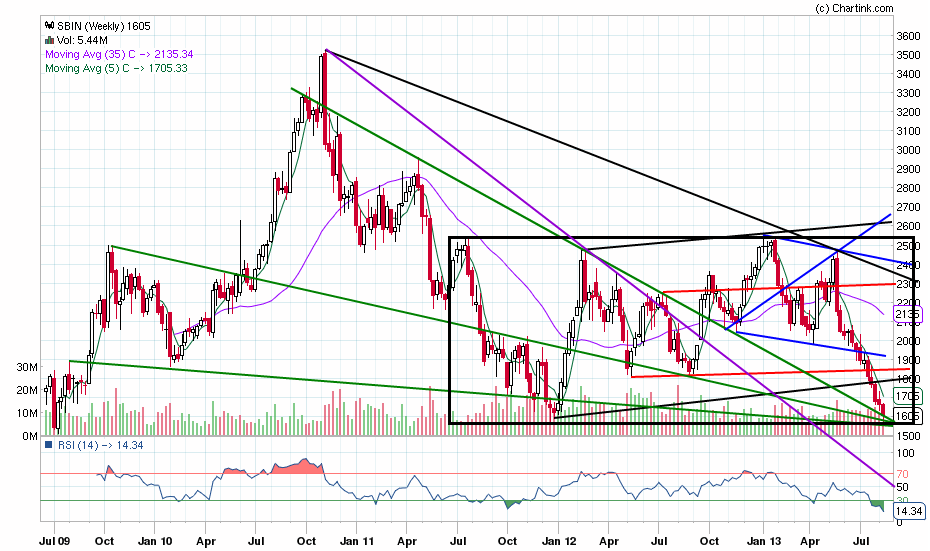
I wrote about my perceptions on State Bank of India in my post SBI 12 August 2013 : An Intermediate Bounce is Due and I was prompted for an update elsewhere. My perceptions continue to remain similar with nothing much to add but it would be worthwhile to post updated charts for the benefit of the readers.
Monthly
Chart posted on 12 August 2013.
Updated Chart. The black channel is already breached and purple LTL is yet to be reached. The intermediate bounce is already over.
Weekly
Chart posted on 12 August 2013.
Updated Charts.
The green TLs in the chart below are likely to support the fall. A WW shown in black will be completed once the price action goes below the Black LTL below 1200 to complete the 5th point. The target for this WW thereafter will be above 2700. I am expecting the fall to finish between black LTL and purple TL.
The chart below shows the channels in the moves so far. Some TLs are shown in purple, which would be of significance.
The chart below shows two incomplete WWs in black and purple.5th of the smaller one, shown in purple, will complete below 1300 and that of the black one will complete below 1200. This also shows that the black wollfe will be invalid if the price action goes below thick black TL.
Daily
Chart posted on 12 August 2013.
Hourly
Moves are perceived as the two possibilities shown below.
Subscribe to:
Posts (Atom)