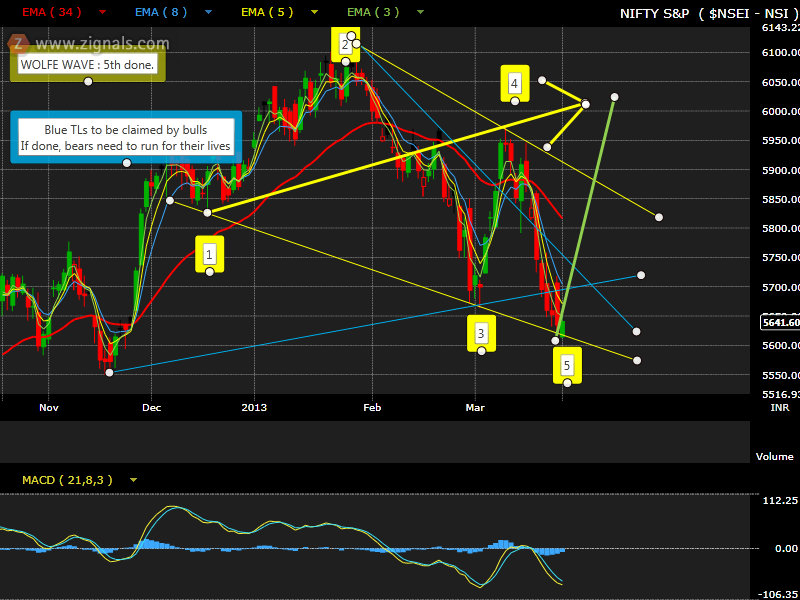
The see-saw in Nifty is likely to continue till March 2013 expiry and the moves are going to be oriented around 5850. The chart below endeavors to depict the path Nifty is likely to follow in the coming fortnight. There is an APF drawn in Red color (and believe me there can be many more drawn) and as I perceive the moves of Nifty is going to be defined by this APF for some time with support from blue and green channels.
There are three WWs forming in Nifty and I expect them to compliment each other while they evolve their right shape. I have already talked about two larger ones in my post
Nifty 11 March 2013 : Two Potential Wolfe Waves and for the third to complete, Nifty must go below 5790.
As per EW, as counted in isolation from 6112, the fall to 5664 could be either a 3 wave or 5 wave ( and I am inclined to see it as a 3 wave form). Inference would be that either the corrective got over at 5664 or only the A of the corrective is done. I am taking it as A because EWO says so. Hence B should do a minimum of 90% of A, which will take Nifty beyond 6067. B.a again looks a clear 5 wave form to me and hence I expect another rise, which is in line with the expectation for B. However B.b is presently doing its own (c) (I expect (b) to be over already and (c) already started but the confirmation will come later). Now if the fall from 5945 is B.b.(c) then it either show a 5 wave form either as an Impulse or an ED. I am inclined for the former and expect it to complete between 5760-5720 by Monday close. B.c and C will follow as 5 wave forms as shown on the chart.
EWO wise, at (c) it should go below (a) easily but when it rises for levels beyond 5972 it is bound to show negative divergence in hourly chart and indicate completion of B and indicate a shorting opportunity.
Trade Setup
For Bears : Good shorting opportunities would be available near or above 6070 only with SL of 6113 and target of 5650 or lower.
For Bulls : Go long between 5760 and 5705 with a SL of 5660 for a target of 6067. Those inclined to hedge, may take 5700 options when the market opens without a gap down on Monday.