I wrote about my perceptions on State Bank of India in my post SBI 12 August 2013 : An Intermediate Bounce is Due and I was prompted for an update elsewhere. My perceptions continue to remain similar with nothing much to add but it would be worthwhile to post updated charts for the benefit of the readers.
Monthly
Chart posted on 12 August 2013.

Updated Chart. The black channel is already breached and purple LTL is yet to be reached. The intermediate bounce is already over.

Weekly
Chart posted on 12 August 2013.
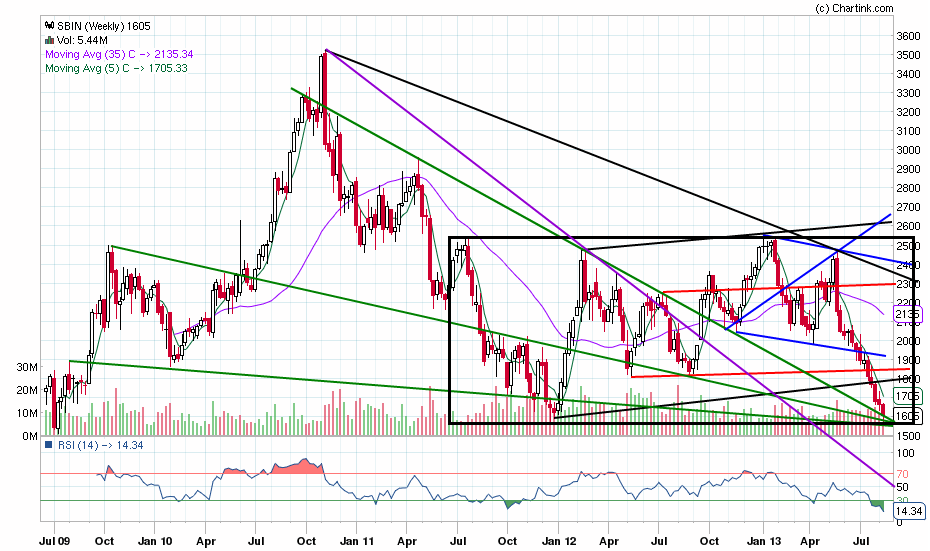
Updated Charts.
The green TLs in the chart below are likely to support the fall. A WW shown in black will be completed once the price action goes below the Black LTL below 1200 to complete the 5th point. The target for this WW thereafter will be above 2700. I am expecting the fall to finish between black LTL and purple TL.

The chart below shows the channels in the moves so far. Some TLs are shown in purple, which would be of significance.

The chart below shows two incomplete WWs in black and purple.5th of the smaller one, shown in purple, will complete below 1300 and that of the black one will complete below 1200. This also shows that the black wollfe will be invalid if the price action goes below thick black TL.

Daily
Chart posted on 12 August 2013.


Hourly
Moves are perceived as the two possibilities shown below.
20140216184632.png)


