Tuesday 26 August 2014

Nifty on 27 August 2014: The highs may still be counting but its time to look lower.

I wrote about my appreciation of Nifty in my last post Nifty Trade Setup 21 August 2014 : The most crucial phase for both bulls and bears. It is clear now that none of the possibilities mentioned in the last post hold any merit and a re-orientation of EW needs to be done.

The perceptions upto weekly still hold good, but, the thoughts on daily chart needs to be re-organised.  With breach of 7959, the possibility of an ED from 7118 becomes invalid and leaves few other possibilities in its wake for ellioticians to ponder upon.

If we consider the move from 4531 as shown in my previous post, the third wave is already extended. However, within the 3rd wave starting from 5118, the moves have become complicated for an impulse.  My endeavour will be to resolve this segment to acceptable possibilities.

As impulse, with the possibility of 3rd extension, the move from 5118 seems to be shaping up as below:


1  :  5118  - 6415   = 1297


2  :  6415  - 5933.3   = -481.7                 ( -37.14 )
3  :  5933.3  - 7968   = 2034.7                 ( 156.88 ) of 1 and
continuing to get extended beyond 8031.

At this juncture, not much clarity is shown by the moves from 5933, especially when all the ticks are accounted for.  However, if closing values are taken and help of other indicators are used to identify the fractals, a possibility emerges.   For which, EW counts for the fractals of move from 5933 may be developing as below:


i  :  5933.3  - 6869.85   = 936.55


ii  :  6869.85  - 6638.55   = -231.3                 ( -24.697 )
iii  :  6638.55  - 7809   = 1170.5                 ( 124.9746 )
iv  :  7809  - 7422   = -387                 ( -33.0642 )
v  :  7422  - 8001   = 579                 ( 61.82265 ) of i **

 Where v th has to push between 8001 and 8145 to keep iii rd extended and i st unextended.  It should also go past 8031 to get 3 rd wave of higher degree extended. The wave itself may be developing as an ED as below:

1  :  7422  - 7841   = 419


2  :  7841  - 7540   = -301                 ( -71.8377 )
3  :  7540  - 7968   = 428                 ( 102.148 )
4  :  7968  - 7658   = -310                 ( -72.38 )**
5  :  7658  - 8095   = 437   ( 102.1028 )**

The point to remember here is that the 5th must go beyond 8001 but cannot go beyond 8145 because if it does, the higher degree presumptions will become invalid.  It also needs to go beyond 8031 to make the 3rd wave at a higher degree extended.  The whole setup are depicted on the chart below:


Now let us see how the fall from 7968 has developed so far.

Simply put, the fractals of the fall may have developed to satisfy this

A     :     7968.25     -    7874.05      =    -94.2           
B     :     7874.05     -    7915.45      =    41.4      (    -43.94904459    )
C     :     7915.45     -    7862.7      =    -52.75      (    55.99787686    )
                               
    T1:    7857.2344    ,  T2:    7821.25    ,  T3:    7763.0344

It may still continue in this manner, as long as 7915.45 is not taken.  However, if we look at it a little differently, we may see fractals of B developing in the following manner.  (If 7915.45 is taken out, the possibility will continue to exist as long as 7968.25 is not taken out.  I am banking on T3 of B, which is the most probable target of an expanded.)

a     :     7874.05     -    7915.45      =    41.4           
b     :     7915.45     -    7862.7      =    -52.75      (    -127.4154589    )
c     :     7862.7     -    7929      =    66.3      (    160.1449275    )**
       
T1:    7888.2852,  T2:    7904.1,  T3: 7929.6852,  T4: 7971.0852   

With 7929 in focus for end of B, the possibility for C is as below.

A     :     7968.25     -    7874.05      =    -94.2           
B     :     7874.05     -    7929      =    54.95      (    -58.33333333    )**
C     :     7929     -    7862.7      =    -66.3      (    70.38216561    )**
       
    T1:    7870.7844    ,  T2:    7834.8    ,  T3:    7776.5844

A breach below T3 will prompt me to change to counting it as an impulse and target 7730 for an A wave of the corrective.  Till then, 7780 remains my target.

The chart depicting the setup is as below:


Wednesday 20 August 2014

Nifty Trade Setup 21 August 2014 : The most crucial phase for both bulls and bears

I had posted my views on Nifty a long time back in Nifty 14 January 2014 : Three Wolves, All Pointing Downwards and Alive.  While one of these wolves met the target, other two fell short.  Subsequent rise continued to push Nifty towards unscaled levels  and here it is...at levels that may be extremes of some of the possibilities.  Let us see how Nifty is shaping up.

Monthly

In monthly, the price action has reached the UTL of a very LT EW channel.  Getting resisted here is highly probable.  Another aspect that needs to be kept in mind is that the move from 6357 (marked as A) continues to hold the possibility to turn into an expanded till 7925.  If we look at the indicators, the negative divergence in both RSI and BEBO are held wrt A, but, there is no negative divergence within the move from 2252 (marked B).  I infer that the current rise still holds momentum for newer highs in future.


Weekly

The EW labels and possible channels, as perceived by me, are marked on the chart below. No negative divergence visible in both RSI and BEBO.  The EW ratios work out as below and clearly shows that the current move from 5118 as 3 has become extended:

1  :  4531  - 6229   = 1698


2  :  6229  - 5118   = -1111   ( -65.4299 )
3  :  5118  - 7922   = 2804   ( 165.1355 )


Daily

The EW labels and possible channels, as perceived by me, are marked on the chart below. Negative divergence is visible in both RSI and BEBO. But the pattern of the indicators keeps me concerned on the positioning of black iii.   The EW ratios work out as below and clearly shows that the current move from 5118 as 3 has become extended:

i  :  5118  - 6415   = 1297


ii  :  6415  - 5933.3   = -481.7   ( -37.1396 )
iii  :  5933.3  - 7563.5   = 1630.2   ( 202.9 ) of v
iv  :  7563.5  - 7118.55   = -445   ( -27.2942 )
v  :  7118.55  - 7922   = 803.45   ( 61.9468 ) of i


While we can delve deeper in the monthly and weekly charts later as the moves evolve, let us see certain key elements of the daily chart. 

Firstly, in the above counts, ii and iv both are shallow.  I have seen it happening on occasions and hence tend to accept it for the time being.  Within iii, the (iv) is just 17.66 % and this one is also accepted with a pinch of salt.

Now, if this is how nifty is shaping up, then,

v should finish between 7920 (already done) and 8126.  If 8126 is violated, nifty will have to scale 9217 to make v extended wrt i.

To resolve the possibility of an expanded move from 7808, nifty need to cross 7956.  If it does not, the possibility will remain alive.

If v is developing as an ED as shown, maximum it can go is upto 7959.  Above this, (iii) of the ED will become smallest, which is not permissible and a reorientation will be necessary.

Given these parameters, 7920-7925 and 7956-7959 bands are crucial.  Ideally, if Nifty reverses from 7956-7959 band, all expanded possibilities would have resolved and what will follow would be 4 that may bring a decent reduction to the levels of Nifty.  Minimum expectation will be 7260 at 23.6%.

Monday 17 February 2014

State Bank of India on 16 February 2014 : Remains Bearish.


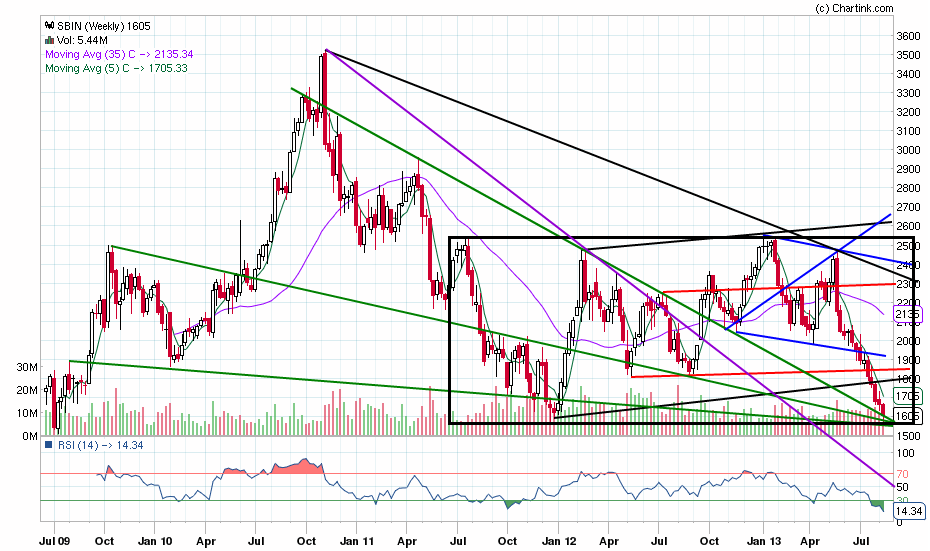
I wrote about my perceptions on State Bank of India in my post SBI 12 August 2013 : An Intermediate Bounce is Due and I was prompted for an update elsewhere.  My perceptions continue to remain similar with nothing much to add but it would be worthwhile to post updated charts for the benefit of the readers.

Monthly

Chart posted on 12 August 2013.


Updated Chart.  The black channel is already breached and purple LTL is yet to be reached.  The intermediate bounce is already over.


Weekly

Chart posted on 12 August 2013.


Updated Charts. 

The green TLs in the chart below are likely to support the fall.  A WW shown in black will be completed once the price action goes below the Black LTL below 1200 to complete the 5th point.  The target for this WW thereafter will be above 2700.  I am expecting the fall to finish between black LTL and purple TL.


 The chart below shows the channels in the moves so far.  Some TLs are shown in purple, which would be of significance.


 The chart below shows two incomplete WWs in black and purple.5th of the smaller one, shown in purple, will complete below 1300 and that of the black one will complete below 1200.  This also shows that the black wollfe will be invalid if the price action goes below thick black TL.


Daily
Chart posted on 12 August 2013.


 Updated Chart.  An additional APF is drawn black and its median coincides with 1300 and LTL coincides with 1200 or lower.


 Hourly

Moves are perceived as the two possibilities shown below.


As long as the UTL of black channel is intact, the bears should prevail.  The consequent targets could remain as 1300 and 1200 and possibly 890 or lower.

Monday 27 January 2014

Ranbaxy 26 January 2014 : A likely shake-off in progress.


I had last written on Ranbaxy at Ranbaxy 29 Jul 2013 : Broken Down.  Ranbaxy breached back into APF and rose to 490 and fell.  This is how I see it as of now...on daily charts...

The daily chart shows three bullish wolfe waves.  These are shown and labeled in Black, blue and red colors. The base-lines of red and black are already breached and that of blue WW is probably still intact.


 EW wise this is how I see the probable fractals...I am expecting the fall to be shaping up as an ED.  The lowest point that I could figure out after catering for bonus, rights and splits is 76, which is an absolute barrier as I am counting start of a new upmove from there.  The rise finished at 660, which I am taking as end of 1. The next lowest is 133.1, which is taken as 2.A and next rise ended at 624, which I am taking as 2.B.  If the current fall is its C then it should fall below 133.1 and may ideally reach 97.  Possible fractal of the fall from 624 is shown in blue on the chart below.


Possible Trades: 

1.   Long near 300 with SL 300 for above 490.
2.   Long near 260 (if reaches) with SL 250 for above 490 and may be more as 3.3(???).
3.   Long near 133.1 or 97 or 76  with SL 75. for target above 660.
4.   Short near 500 with SL 501 for below 250 and ideally below 133.

As and when they come.


Update 25 February 2014


 The APFs  indicate the reason for the rise from 308.  The SFF indicates the likely zone for the correction to the rise.


The hourly showed a clear evening star.  But it would oblige the bears or not, is a million $ question.  A -ve divergence is also visible and makes the case stronger for the bears.


Tuesday 14 January 2014

Nifty 14 January 2014 : Three Wolves, All Pointing Downwards and Alive.

Writing after a long gap.  The charts of Nifty show two possible wolves on daily charts as shown in the chart below:

 ...and shows another in the 15 minutes chart as shown below.